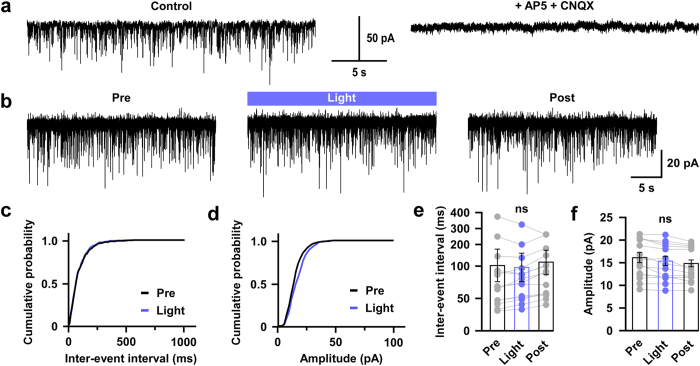
Figure 2. Activation of serotonergic nerve endings did not affect glutamatergic inputs onto orexin neurons.
(a) EPSCs were recorded from orexin neurons at −60 mVhold in the presence of intracellular QX-314 (1 mM) and extracellular picrotoxin (400 μM). EPSCs were completely blocked by adding NMDA and AMPA receptor antagonist, namely AP-5 (50 μM) and CNQX (20 μM), respectively. (b) Traces showing the effect of continuous blue light illumination of 50% intensity for 30 sec. Representative cumulative probability plot shows that activation of 5-HT nerve endings did not change EPSC frequency (c) and amplitude (d). Combined bar and scatter plots summarize the data for EPSC (e) interval (p = 0.93 vs pre, 0.79 vs post) and (f) amplitude (p = 0.62 vs pre, 0.73 vs post) (n = 14). Data are provided as mean ± s.e.m. (ns, not significant; p value was calculated by one-way ANOVA followed by post hoc Fisher’s least significant difference (LSD) test).

