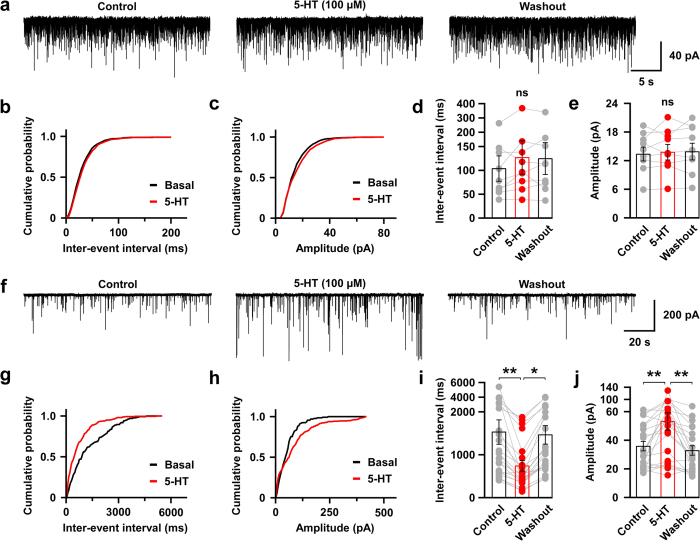
Figure 5. Local application of 100 μM of 5-HT mimics the effect of light evoked activation of 5-HT nerve endings.
(a–e) EPSCs were recorded from orexin neurons at −60 mVhold in the presence of intracellular QX-314 (1 mM) and extracellular picrotoxin (400 μM). (a) Traces showing the effect of local application of 100 μM of 5-HT on EPSCs. Representative cumulative probability plot shows that local application did not change EPSC frequency (b) and amplitude (c). Bar and scatter plot summarizes the data on EPSC interval (d) (p = 0.60 vs pre, 0.97 vs post) and amplitude (e) (p = 0.86 vs pre, 0.92 vs post) (n = 9). (f–j) IPSCs were recorded from orexin neurons at −60 mVhold in the presence of intracellular QX-314 (1 mM) and extracellular AP-5 (50 μM) and CNQX (20 μM). (f) Traces showing the effect of local application of 100 μM of 5-HT on IPSCs. Representative cumulative probability plot shows the effect of local application on the inter-event interval (g) and amplitude (h). Bar and scatter plot summarizes the data on the IPSC interval (i) (p = 0.007 vs pre, 0.02 vs post) and amplitude (j) (p = 0.007 vs pre, 0.002 vs post) (n = 21). ns, not significant; *p < 0.05, **p < 0.01, ***p < 0.001. p values were calculated by one-way ANOVA followed by a post hoc Fisher’s LSD test).

