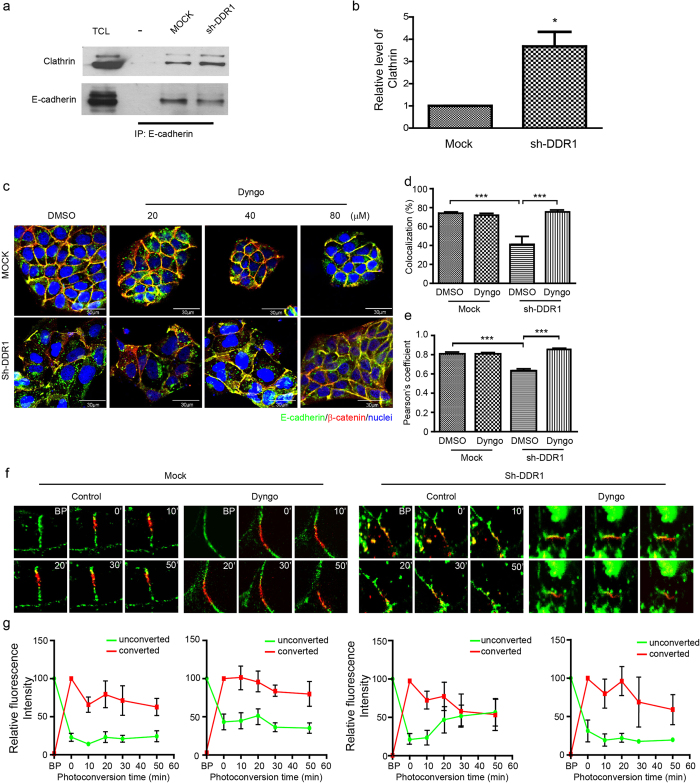
Figure 2. Clathrin-mediated endocytosis is involved in the knockdown of DDR1-induced E-cadherin endocytosis.
(a) The interaction between E-cadherin and clathrin in Mock or Sh-DDR1 cells was assessed using immunoprecipitation of E-cadherin, followed by immunoblotting with anti-clathrin heavy chain or anti-E-cadherin antibodies. TCL represents total cell lysate; “-” represents immunoprecipitation with the control antibody. (b) Quantification results of the ratio of clathrin/E-cadherin intensity. Each bar represents mean ± SE of three independent experiments. *Indicates P < 0.05. (c) Mock and Sh-DDR1 cells were plated for 24 h and then treated with DMSO or specific dynamin inhibitor Dyngo® 4a (Dyngo) for 4 h at the indicated concentrations. Cells were then fixed and immunostained with E-cadherin (green) and β-catenin (red). Bar: μm. (d) The fluorescence intensity profiles of the colocalisation of E-cadherin and β-catenin were assessed using Olympus FV-1000 imaging software. (e) The fluorescence intensity profiles of the Pearson’s correlation coefficient of E-cadherin and β-catenin were assessed using Olympus FV-1000 imaging software. (f) Mock and Sh-DDR1 cells were transiently transfected with HECD-mEosFP and incubated on chamber slides for 24 h. After receiving DMSO or Dyngo® 4a (Dyngo) treatment for 4 h, Mock and Sh-DDR1 cells were subjected to photoconversion analysis. The HECD-mEos emission wavelengths of 516 nm (green or unconverted) or 581 nm (red or converted) before and after photoconversion by a 405-nm laser was recorded at the indicated times for Mock and Sh-DDR1 cells. The images shown here are the represented images of at least three independent experiments. BP: before photoconversion. (g) The quantification results of each photoconversion study are shown underneath each treatment of (f).

