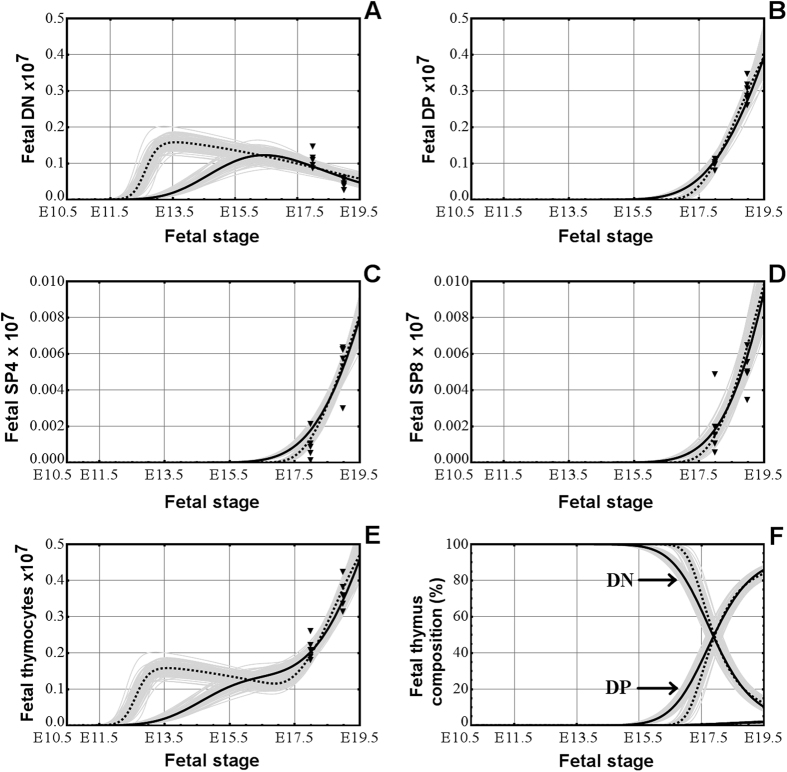
Figure 1.
The development of the DN (A), DP (B), SP4 (C), and SP8 (D) thymocyte populations in the pre-natal thymus, simulated by model M1.V1 (continuous line) and model M2.V1 (dotted line). (E) The changes in the whole number of thymocytes in the pre-natal thymus in both models. (F) The dynamics of the thymocyte composition in the pre-natal thymus, in both models. The filled triangles on each chart are the experimental number of thymocytes at the respective time points.

