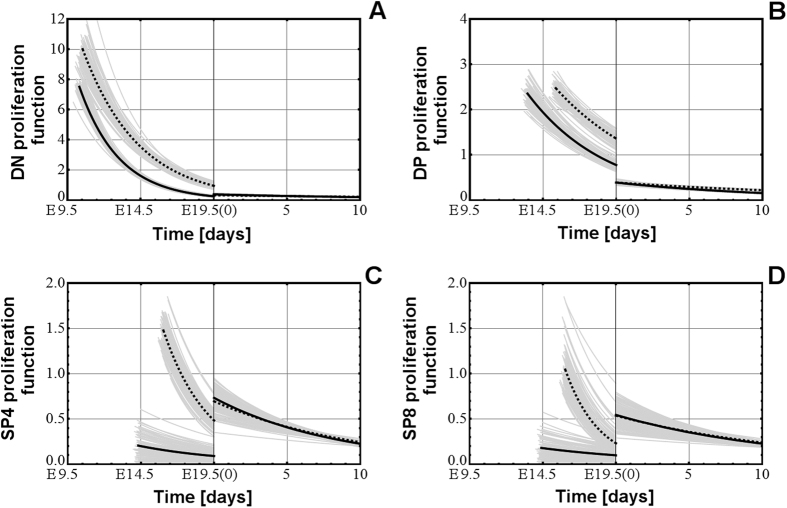
Figure 3.
The discontinuity at birth in the proliferation rates of the DN (A), DP (B), SP4 (C), and SP8 (D) thymocyte populations in the pre-natal and post-natal period, in model M1.V1 (continuous line) and in model M2.V1 (dotted line). The vertical, thickened line at 19.5(0) represents the borderline between the end of pregnancy and the beginning of the post-natal life.

