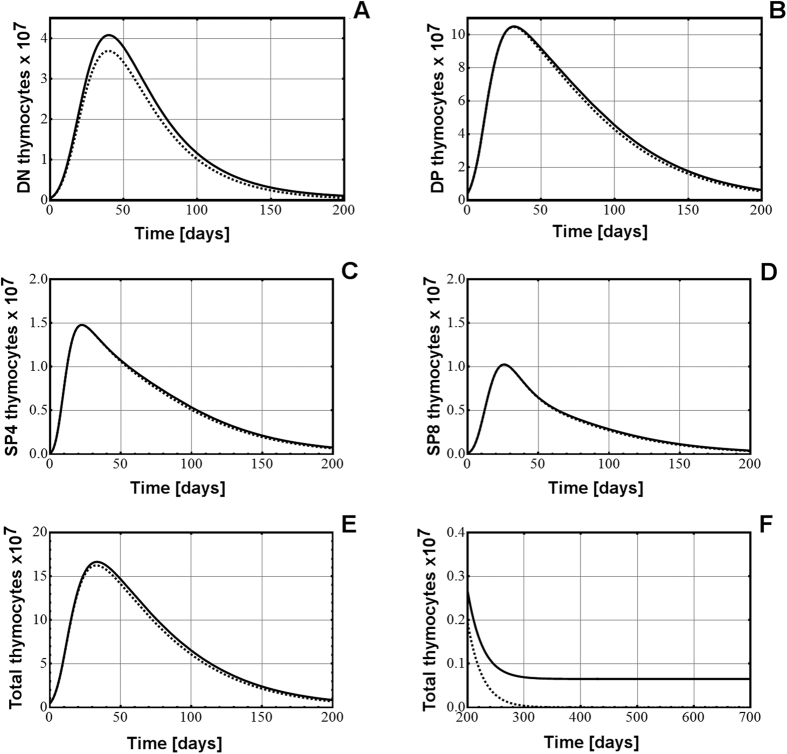
Figure 4. The relationship between the bone marrow progenitors and the post-natal thymus homeostasis, examined by the model M1.V1.
(A) The impact of completely eliminating the bone marrow progenitors in the post-natal life (by setting b(t) = 0 on the DN thymocyte population). The same impact on the DP (B), SP4 (C), SP8 (D) thymocyte populations, and total number of thymocytes in the thymus (E). (F) the changes in the total number of thymocytes in the post-natal thymus, between 200–700 days. In each chart the continuous, thin black line is the numerical change in the thymocyte populations with a constant inflow of progenitors at the level at birth (b(t) = b0), and the dotted curve is the change in the thymocyte populations with post-natal progenitors set at zero (b(t) = 0).

