
Figure 2. Box plots for alpha-diversity of the bacterial communities in different seasons in the successional tidal flat series.
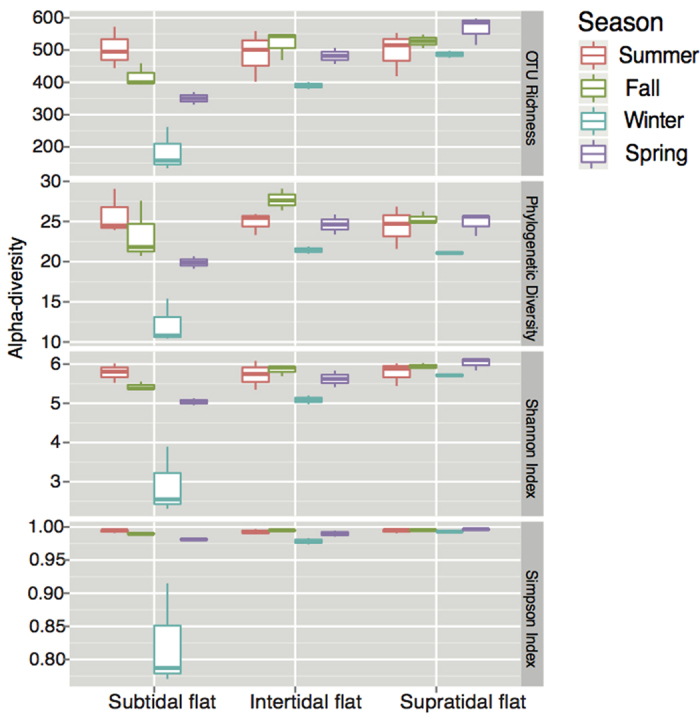
The ends of the whiskers represent the minimum and maximum, the bottom and top of the box are the first and third quartiles, and the line inside the box is the median.