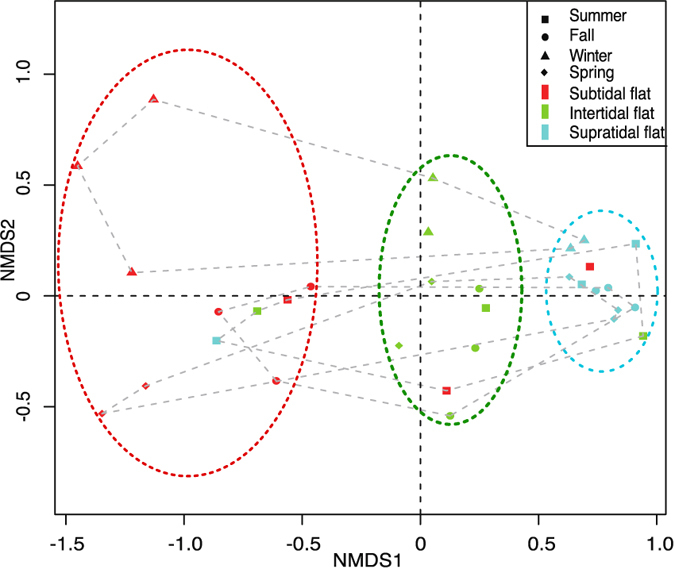
Figure 3. The NMDS plots for bacterial community structure based on Unifrac distance.

Samples from three plots in the same tidal flat are represented by different colors. Samples from the four seasons are represented by different shapes of symbols.

Samples from three plots in the same tidal flat are represented by different colors. Samples from the four seasons are represented by different shapes of symbols.