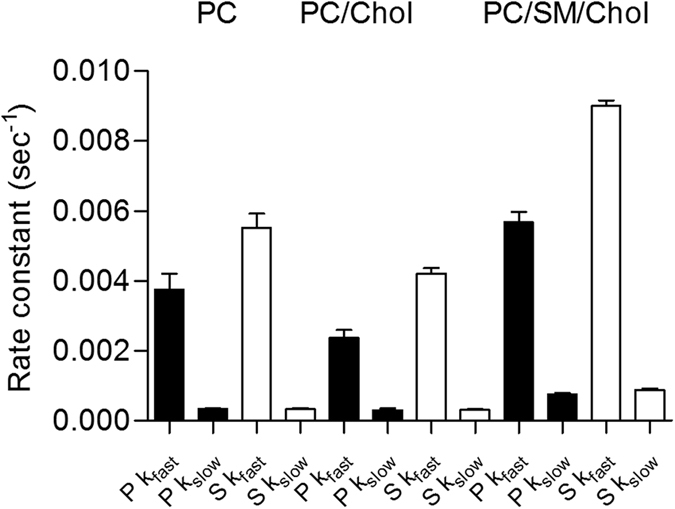
Figure 3. Rate constants obtained with p- and s-polarized light for the reconstitution of CCR5 StaR into a lipid membrane composed of POPC, POPC/chol (8/2 mol/mol) and POPC/SM/Chol (6/2/2 mol/mol/mol).

The reconstitution process follows a two-stage exponential process with two rate constants associated (fast and slow) (see Materials and Methods for details). Black and white bars correspond to the data obtained with p- and s-polarized data, respectively. Data in bars correspond to the mean value and associated standard deviation obtained from at least 4 independent experiments. Significativity of the difference between the values is presented in Table SII.
