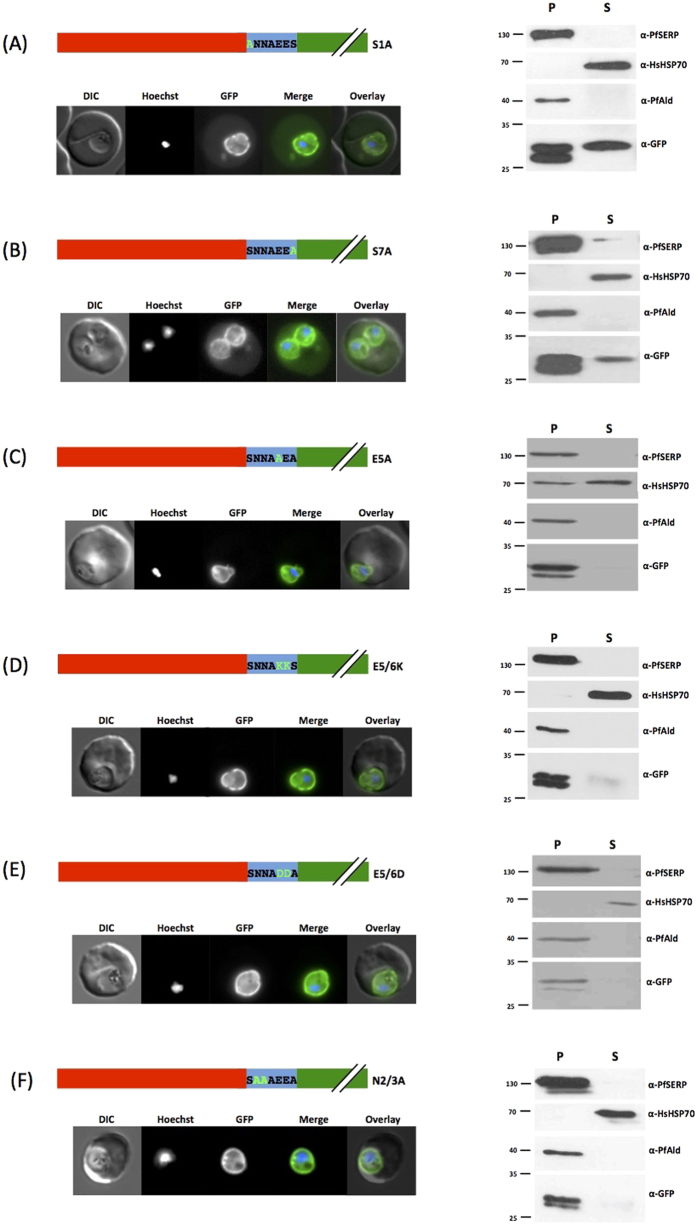
Figure 4. Site directed mutagenesis of the export motif.
Left panel shows structure of expressed PfHsp70x-GFP chimeras and live cell imaging of transfectants, right shows Streptolysin O fractionation followed by western blot using the antibodies indicated. Mutated residues are shown in light green, original motif in bold. Red indicates the first 25 amino acids of PfHsp70x, predicted signal sequence. Numbering refers to position in motif following signal sequence cleavage. DIC, differential interference contrast; in merge and overlay blue, Hoechst (nuclear stain); green, GFP; S, supernatant following SLO fractionation; P, pellet following SLO fractionation. Size markers in kDa. Pictures are representative of at least 10 individual observations, western blots of at least 3 independent experiments. The lower GFP band in the pellet fraction is a commonly observed GFP degradation product.

