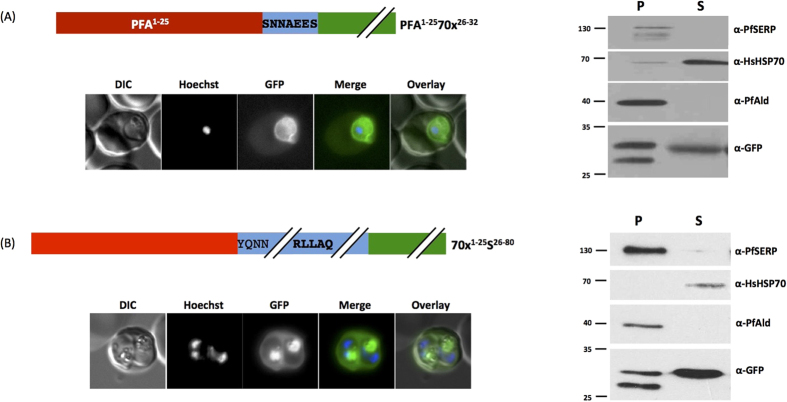
Figure 6. The nature of the signal sequence does not influence protein export.
Left panel shows structure of expressed chimera and live cell imaging of transfectants, right shows Streptolysin O fractionation followed by western blot using the antibodies indicated. (A) Light red indicates predicted signal sequence from PfHsp70x, dark red from the exported co-chaperone PFA660 (PF3D7_0113700). In (A) PfHsp70x export motif is shown in bold. In (B) PEXEL motif is shown in bold. DIC, differential interference contrast; in merge and overlay blue, Hoechst (nuclear stain); green, GFP; S, supernatant following SLO fractionation; P, pellet following SLO fractionation. Size markers in kDa. Pictures are representative of at least 10 individual observations, western blots of at least 3 independent experiments. The lower GFP band in the pellet fraction is a commonly observed GFP degradation product.

