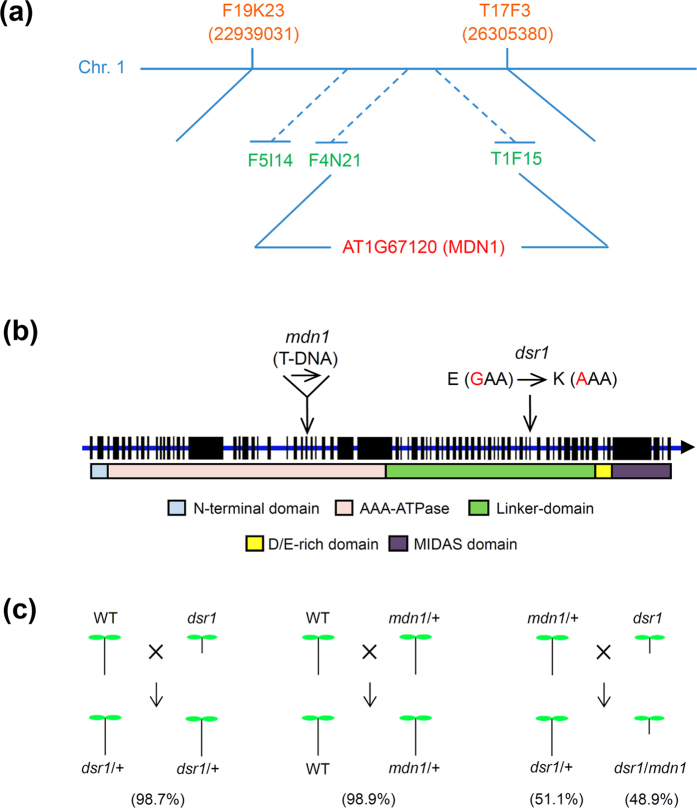
Figure 2. Map-based cloning of dsr1.
(a) Map position of dsr1 on chromosome 1 (At1g67120). Some of the BAC markers used in the present study are indicated. (b) The gene structure and protein domains of AtMDN1 are shown. The exons are shown as black boxes, and the introns are presented as blue lines. The dsr1 mutation site and the inserted position of the T-DNA insertion mdn1 mutant are indicated. (c) Complementary experiments of dsr1. The percentages of F1 plants with normal or short roots are indicated.

