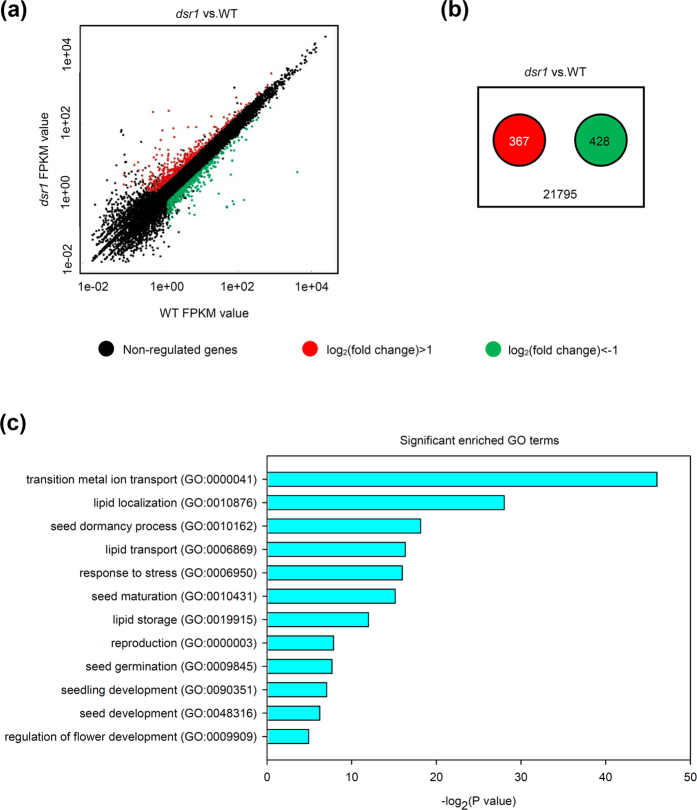
Figure 5. Comparison of the transcript profiles between wild type and dsr1.
(a) Scatter plot of FPKM values for all detected genes in wild type and dsr1 plants. The red plots indicate the significantly up-regulated genes, while the green plots indicate the down-regulated genes (P < 0.05). (b) The number of differentially expressed genes significantly up-regulated (red) or down-regulated (green) in the dsr1 mutant. (c) GO terms significantly enriched (P < 0.05) with the differentially expressed genes in the dsr1 mutant. The GO terms were sorted based on P values.

