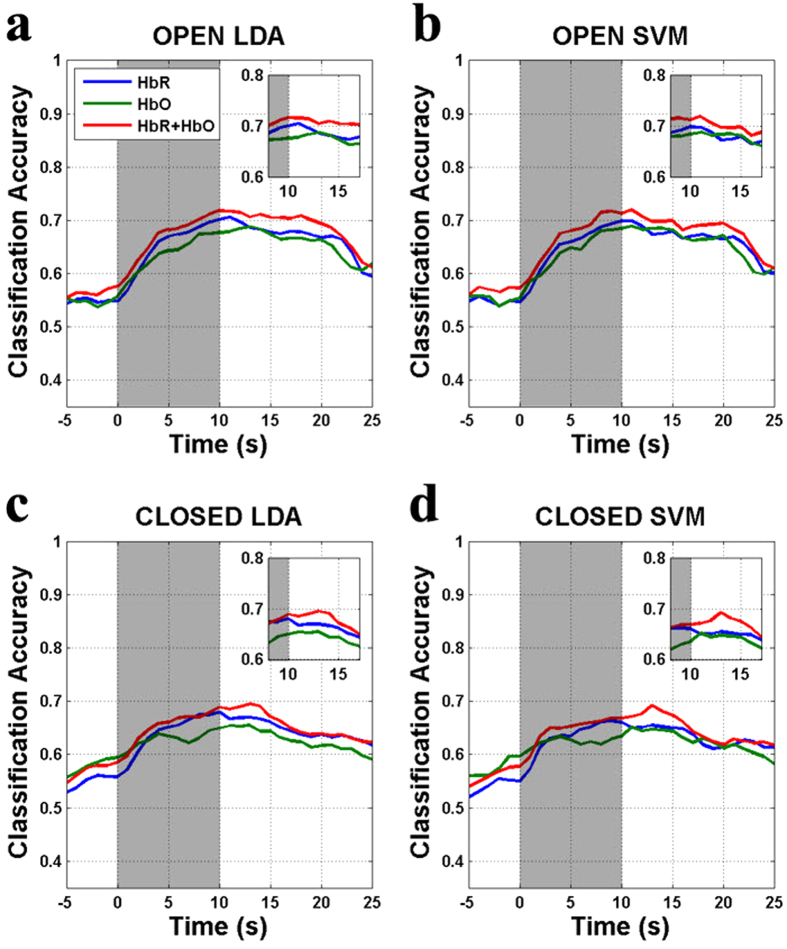
Figure 4.
Grand-average of classification accuracies as a function of time: (a) SVM and (b) LDA and for EO and (c) SVM and (d) LDA for EC. Gray patch denotes the task period: [0 10] s. The classification accuracy is estimated using the feature vectors by sliding time window (window size: 3 s, step size: 1 s, 33.3% overlap). X-axis presents the right end of the sliding time window. Y-axis indicates the classification accuracy.

