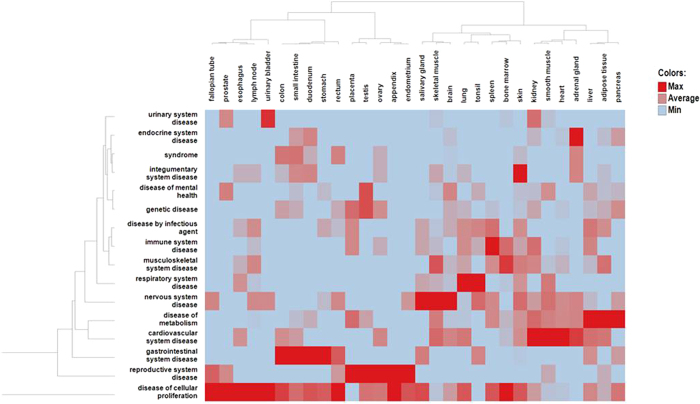
Figure 2. Ward’s hierarchical clustering of all drug-targets and their top three predicted tissue assignments across different disease classes.
Each data point represents the number of targets for a specific tissue in a particular disease class. For example, targets associated with diseases of cellular proliferation (Cancer) are clustered across several tissues because they are indicated for cancers involving multiple tissues. Similarly diseases of metabolism include targets for diseases such as Obesity, Hyperuricemia, and Amylodosis and are often associated with multiple tissues. In contrast, urinary system diseases are highly specific in that they target kidney, urinary bladder and prostate. The color scale shown in the figure used only min/max/average values (min = 0, avg = 3.75, max = 28).

