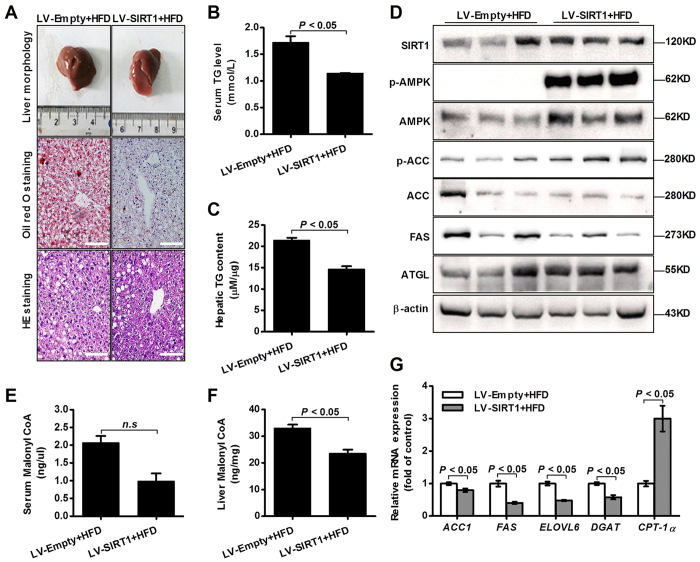
Figure 5. SIRT1 overexpression suppresses hepatic triglyceride accumulation in HFD-fed mice.
(A) The liver sections of the LV-SIRT1 group were stained by Oil red O and H&E. (Scale bar: 15 μm). (B,C) Serum and hepatic triglycerides were measured. Data are shown as the mean+SEM (n = 5). (D) Immunoblotting analysis of the expression levels of SIRT1, phospho-AMPK/ACC, ATGL and FAS. (E,F) Malonyl-CoA level was determined by the ELISA. Data are expressed as the mean ± SEM (n = 5). (G) Quantitative real-time PCR analysis of the mRNA levels of lipid-related genes. Data are expressed as the mean ± SEM (n = 3).

