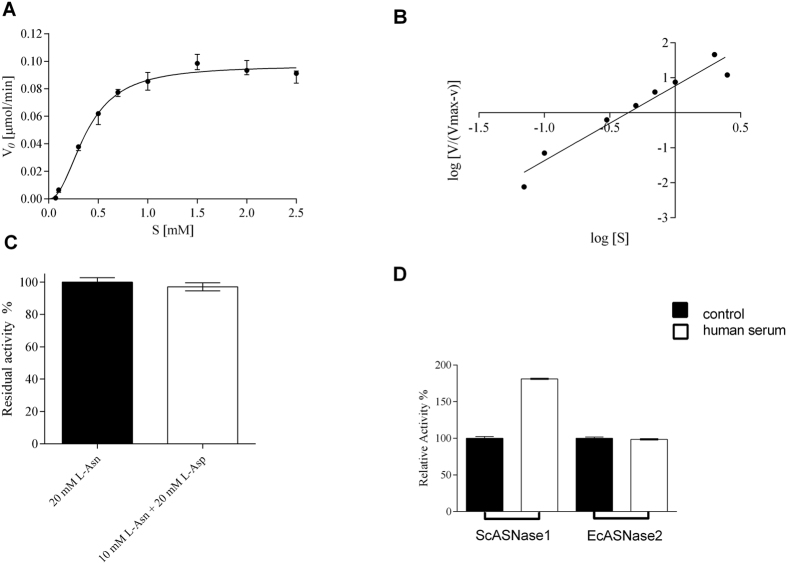
Figure 2. Influence of L-Asp and L-Gln on the parameters of ScASNase1.
(A) ScASNase1 kinetic parameters using L-Asn and L-Gln together as substrates at the ratio of 1:16; activity dependence on a substrate concentration plot. (B) Hill plot of the data. Points represent means ± SD (n = 3). (C) Specific activity of ScASNase1 with added L-aspartate. 20 mM L-asparagine (L-Asn, 20 mM) and 10 mM L-asparagine + 20 mM L-aspartate (20 mM L-Asn + 10 mM L-Asp). (D) Specific activity of ScASNase1 and EcASNase2 after incubation at 37 °C for 60 minutes with 10% human serum. The graphs of specific activities and kinetic parameters were obtained with GraphPad Prism 6.05 software. The specific activity was quantified by Nessler’s reagent. Error bars were calculated from the mean ± SD (n = 3).

