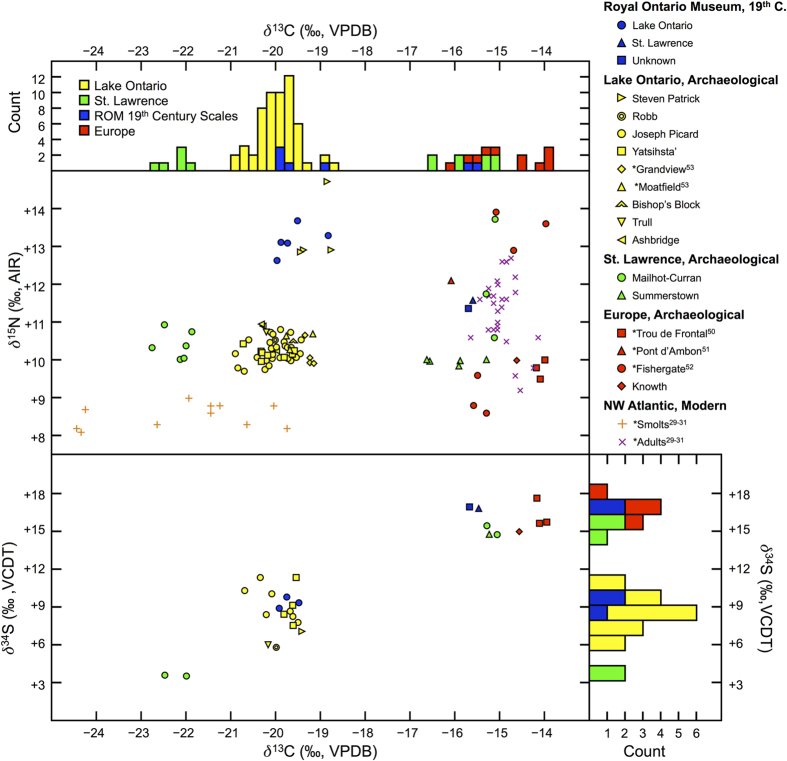
Figure 2. Bivariate plots of δ13C vs. δ15N (top) and δ13C vs. δ34S (bottom) values and histograms showing separation of δ13C (left) and δ34S (right) values for salmon from different regions.
Comparative salmon data from modern scales29,30,31 as well as European50,51,52 and North American53 archaeological bone are denoted by an asterisk. Modern scale δ13C data has been adjusted by +1.25‰ to account for historical changes in environmental δ13C59,60. Data points for modern smolt (n = 442) and adult (n = 1866) salmon scales are average values for separate sample populations (including between 21 and 249 individual fish) in Europe, Greenland, and North America.

