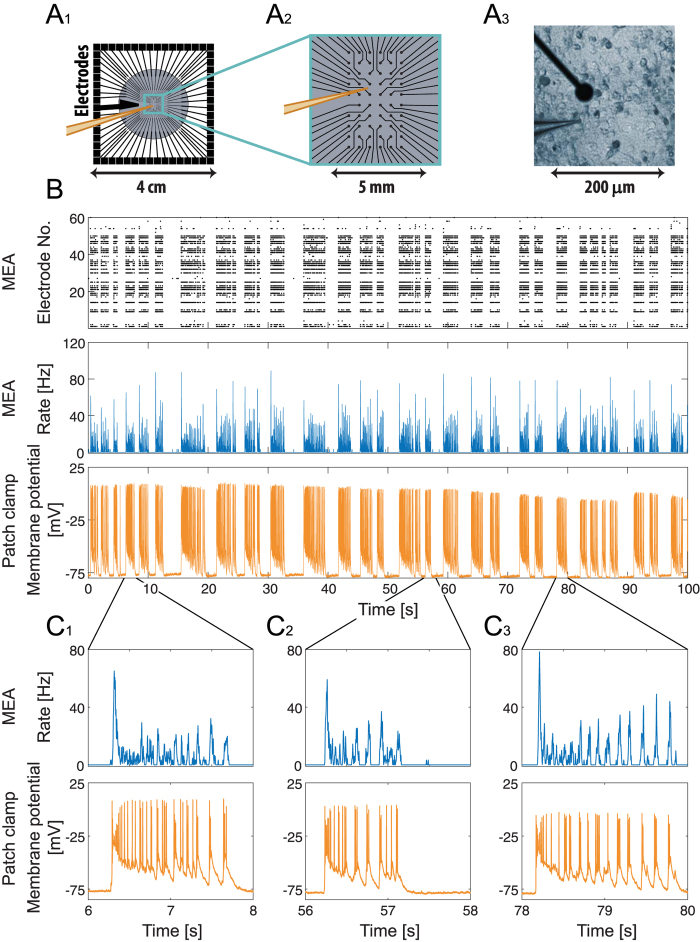
Figure 2. A single neuron current-clamp recording reflects the cooperative network burst activities recorded by an extracellular multi-electrode array (MEA).
(A1) A schema of the in-vitro apparatus measurement consisting of a 60 multi-electrode array. The cortical tissue culture (~1.3 million neurons) is plated in the gray circle area, ~5 cm2. The light-blue square represents the area covered by the extracellular electrodes. The orange electrode represents an intracellular patch electrode. (A2) A zoom-in of the area covered by the extracellular electrodes. Extracellular electrodes are separated by 0.5 mm with a diameter of 30 μm each, covering an area of (2.5 mm) × (4.5 mm). (A3) A snapshot of a part of the neuronal culture, demonstrating simultaneous recordings with an extracellular electrode (top) and an intracellular patch electrode (bottom). (B) Upper panel: A raster plot of the activity recorded by the 60 extracellular electrodes over a period of 100 seconds. Each row represents the activity recorded by an extracellular electrode and each dot represents a detected spike. Middle panel: The temporal rate activity of the multi-electrode array presented in the upper panel was calculated using a convolution (see Methods). Lower panel: The membrane potential of the current-clamped neuron placed near an extracellular electrode, (A3), recorded simultaneously with the extracellular recordings shown in the upper panels. (C) A zoom-in of three of the bursts shown in (B) (middle and bottom panels), for the network firing rate, recorded by the extracellular electrodes (top), and the voltage of the single neuron recorded by an intracellular electrode (bottom). Results indicate a high degree of correlation between the burst activities of the network and the single neuron.

