
Figure 3. Quantitative statistical description of the correlations between bursting activities and intracellular spiking and membrane potential recordings.
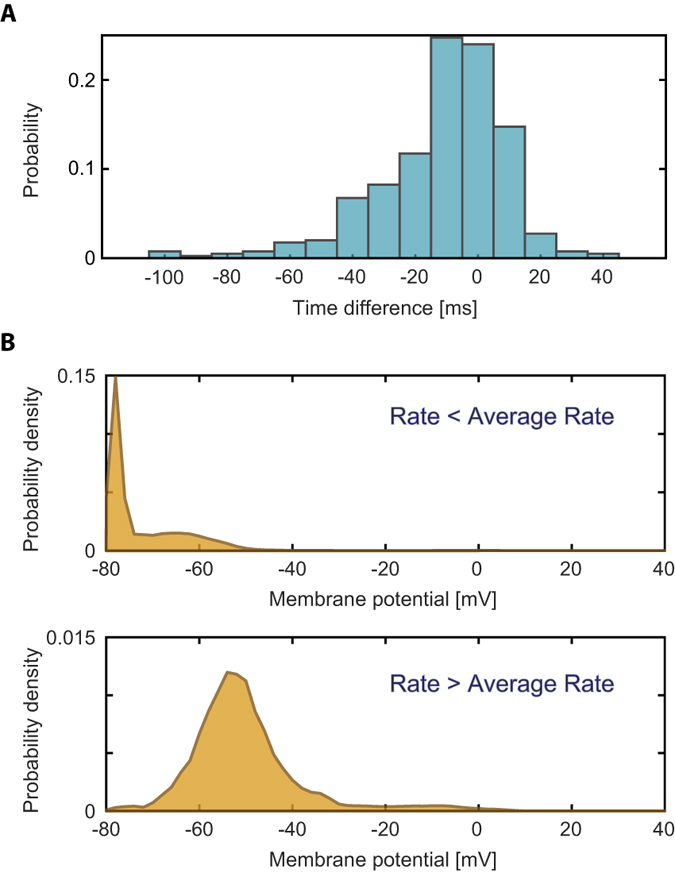
(A) The probabilities of the time difference between the intracellularly recorded spikes and MEA bursts of Fig. 2. Specifically, for every threshold crossing of the rate to above 20 Hz, the shortest time difference to a threshold crossing of the neuronal membrane potential to above −25 mV was calculated. (B) The probability density function of the membrane potential of the neuron of Fig. 2, separated for sampling points where the temporal rate of the MEA recorded spikes is above its average, ~2.8 Hz, (upper panel) and below its average (lower panel). The sum up of these two probability densities together is unity.