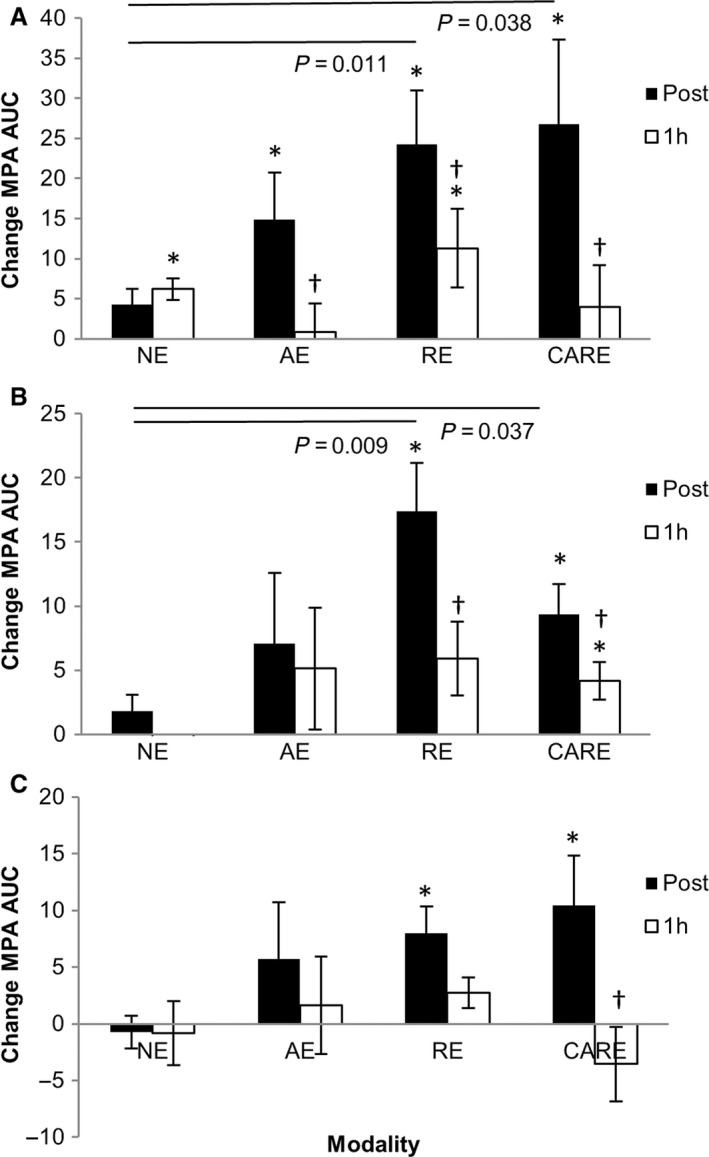
Figure 1.

Change (mean ± SE) from the ‘pre’ time‐point (area under the curve) for agonist‐induced monocyte‐platelet aggregate formation. Blood collected pre, post, and 1 h post; no‐exercise (NE), aerobic exercise (AE), resistance exercise (RE) and combined aerobic and resistance exercise (CARE), and incubated with arachidonic acid (A), thrombin receptor activating peptide (B) and collagen‐related peptide (C). *signifies significant difference from pre, †signifies significant difference from post (P < 0.05).
