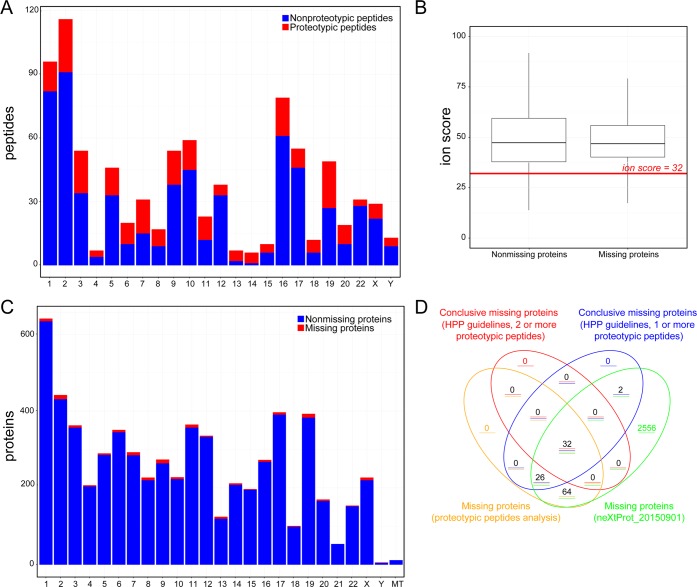
Figure 4.
(A) Distribution of tryptic and proteotypic peptide candidates detected in the analyzed samples along the different chromosomes. (B) Boxplot with the distribution of Mascot ion scores obtained for the PSMs assigned to missing and nonmissing proteins. The difference between these distributions is statistically significant with a p-value < 1 × 10–12. (C) Distribution of missing and nonmissing proteins potentially detected in the analyzed samples using the identification of proteotypic peptides along chromosomes. (D) Venn diagram with the missing proteins observed using the HPP guidelines and the workflow proposed here and with the missing proteins in neXtProt database release 20150901.

