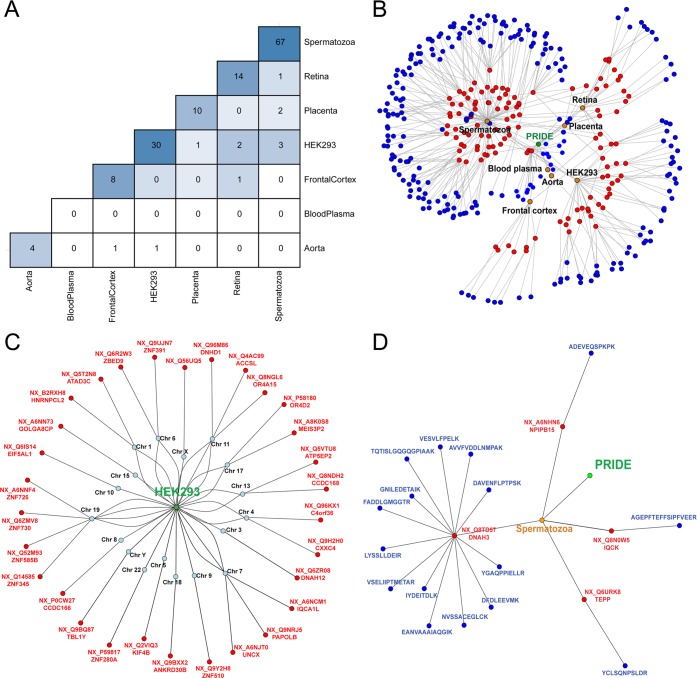
Figure 5.
(A) Heat map with the missing proteins potentially detected in each sample and the missing proteins shared between each pair of samples analyzed. (B) Network representation of the results obtained for the study of the missing proteins using the PRIDE database. Nodes represent the database of experiments used (green), the tissue (orange), the proteins observed (red), and the identified peptides (blue). (C) Network for the missing proteins potentially observed in the HEK293 sample. Nodes represent the sample selected (green), the chromosome (blue), and the identified protein (red). (D) Network for the missing proteins potentially detected in chromosome 16. Nodes represent the sample (orange), the proteins observed (red), and the identified peptides (blue).

