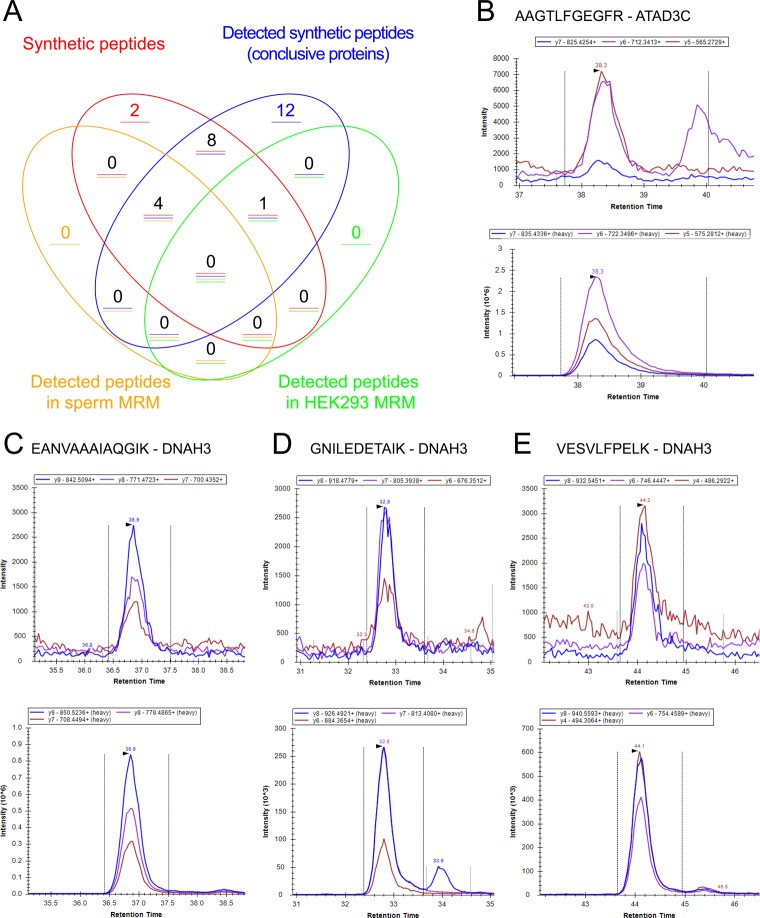
Figure 8.
(A) Venn diagram with the peptides selected for detection and the results of the different stages of the validation analysis. (B) Endogenous (upper) and synthetic heavy peptide (lower) LC-SRM signals measured for the peptide AAGTLFGEGFR from ATAD3C in the HEK293 cell line. (C) Endogenous (upper) and synthetic heavy peptide (lower) LC-SRM signals measured for the peptide EANVAAAIAQGIK from DNAH3 in the spermatozoa sample. (D) Endogenous (upper) and synthetic heavy peptide (lower) LC-SRM signals measured for the peptide GNILEDETAIK from DNAH3 in the spermatozoa sample. (E) Endogenous (upper) and synthetic heavy peptide (lower) LC-SRM signals measured for the peptide VESVLFPELK from DNAH3 in the spermatozoa sample.

