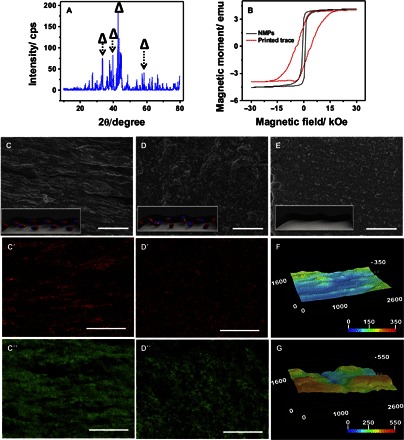
Fig. 2. XRD, SEM-EDX, and three-dimensional optical characterization.

(A) XRD spectra for NMPs. (B) Magnetic hysteresis curves for NMPs (black plot) and self-healing trace (red plot). SEM (C), EDX (for neodymium) (C′), and EDX (for carbon) (C″) images of an aligned self-healing printed trace. SEM (D), EDX (for neodymium) (D′), and EDX (for carbon) (D″) images of a nonaligned printed trace. (E) SEM image of a printed trace based on a CB ink (no NMPs). Three-dimensional (3D) optical images of (F) aligned and (G) nonaligned printed traces. Scale bars, 200 μm (C to E). Scale bars in μm (F and G). emu, electromagnetic unit; cps, counts per second; kOe, kilo-oersted.
