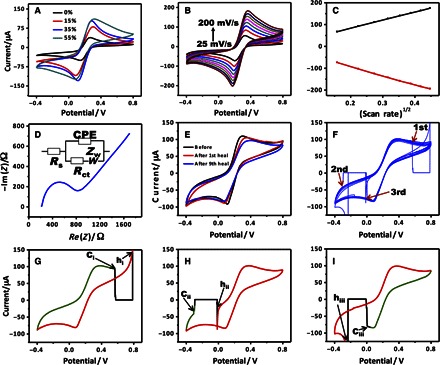
Fig. 4. Electrochemical characterization of self-healing electrodes.

CV plots for printed self-healing traces (A) with varying amounts of NMPs and (B) at different scan rates. (C) Plot showing linear dependence of anodic (black plot) and cathodic (red plot) peak current versus square root of scan rate. (D) Nyquist plot for self-healing printed electrode (inset: schematic showing the electrical circuit simulating the electrode-electrolyte interface). (E) CV plots recorded for a self-healing trace before any damage (black plot), after first damage with a width of 1 mm (red plot), and after nine repeated damages (blue plot) at the same location (three times each for damage widths of 1, 2, and 3 mm). (F) CV plot illustrating real-time recovery of three repeated 3-mm-wide damages. Individual CVs showing the point at which the electrode is damaged and the point where the self-healing is initiated for the (G) first, (H) second, and (I) third consecutive 3-mm-wide damage at the same location (“ci” to “ciii” represent the time when the electrode was damaged by 3 mm three times, whereas “hi” to “hiii” represent the time when the healing process began after the corresponding damage). (G to I) Green, black, and red colors represent data before cutting, during damage, and after healing, respectively.
