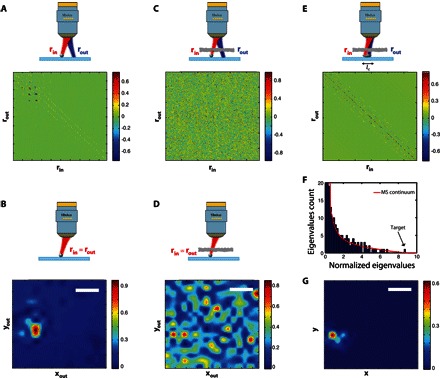
Fig. 2. Target detection in the deep MS regime.

(A) The reference time-gated reflection matrix R0 measured for a ZnO bead deposited on a glass slide. (B) En face OCT image deduced from R0 (Eq. 1). (C) The time-gated reflection matrix R in the presence of a strongly scattering layer (L = 12.25ls). (D) En face OCT image deduced from R (Eq. 1). (E) The SS matrix RS deduced from R with lc = 5 μm (Eq. 3). (F) The eigenvalue histogram of RSR†S compared to the random matrix prediction (red line): the largest eigenvalue emerges from the MS noise. (G) Smart-OCT image deduced from the first eigenstate of RS. Scale bars, 10 μm.
