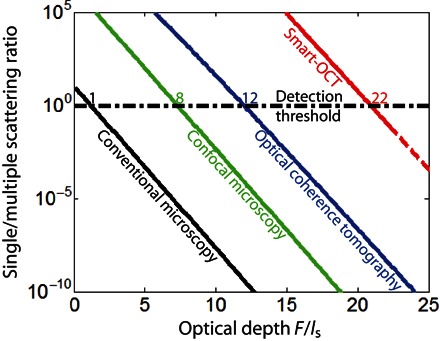
Fig. 5. Imaging-depth limit in human soft tissues.

This graph compares the SMRs expected for conventional microscopy (black line), confocal microscopy (green line), OCT (blue line), and smart-OCT (red line) as a function of the optical depth F/ls. The y axis is in log scale. These curves have been computed from the theoretical study developed in section SII, considering experimental parameters typical of full-field OCT (42). The detection threshold (SMR, ~1; black dashed horizontal line) yields the following imaging-depth limits: ~1ls for conventional microscopy, ~8ls for confocal microscopy, ~12ls for OCT, and ~22ls for smart-OCT.
