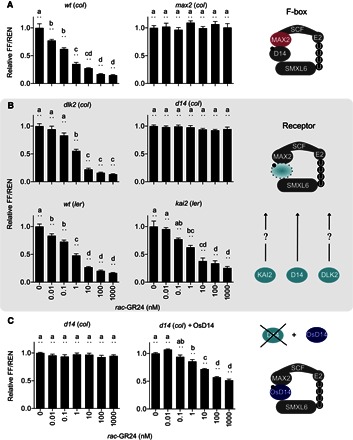
Fig. 2. StrigoQuant biosensor for the study of the SL perception machinery.

(A) StrigoQuant biosensor for the study of the SL perception machinery Characterization of the StrigoQuant sensor construct in protoplasts isolated from WT [Columbia (col-0), ecotype] and max2 (col) mutant Arabidopsis backgrounds upon addition of increasing concentrations of rac-GR24 (left). Protoplasts were isolated from the seedlings of each genotype and transformed with StrigoQuant. Twenty-four hours after transformation, protoplasts were supplemented with increasing concentrations of a rac-GR24 serial dilution for 2 hours before luciferase activity determination. On the right, the schematic principle of the experiment is shown, where the functionality of the F-box protein MAX2 for SL-mediated SMXL6 degradation was analyzed. (B) Characterization of the StrigoQuant sensor construct in protoplasts isolated from WT and mutant Arabidopsis backgrounds for potential SL receptors upon addition of increasing concentrations of rac-GR24 (left). Protoplasts were isolated from Atd14 (col), dlk2 (col), WT [Landsberg erecta (ler), ecotype], and kai2 (ler) seedlings and transformed with StrigoQuant. Twenty-four hours after transformation, protoplasts were supplemented with increasing concentrations of a rac-GR24 serial dilution for 2 hours before luciferase activity determination. On the right, the schematic principle of the experiment is shown, where the functionality of AtD14, DLK2, and KAI2 in mediating SMXL6 degradation was tested. (C) Characterization of the effect of overexpression of OsD14 in Atd14 (col) protoplasts. Protoplasts isolated from Atd14 (col) seedlings were transformed either only with StrigoQuant and a stuffer plasmid (pGEN16; with equal amounts of 15 μg each) or with StrigoQuant and a plasmid harboring OsD14 (with equal amounts of 15 μg each) and induced with rac-GR24 for 2 hours before luminescence determination. On the right, a schematic principle of the experiment is shown, where OsD14 was overexpressed in protoplasts lacking AtD14 to rescue functional SMXL6 degradation. Results for each panel are averaged FF/REN ratios, normalized to the sample without addition of any inducer substrate for each genotype. The data shown correspond to one representative experiment of four replicated experiments for (A) and (B) and three experiments for (C). Error bars represent SEM from the individual experimental data shown. n = 6. Statistical significance between the tested concentrations within a genotype is indicated with lowercase letters above each bar, where “a” significantly differs from “b,” “b” from “c,” and so on. One-way analysis of variance (ANOVA), P < 0.01.
