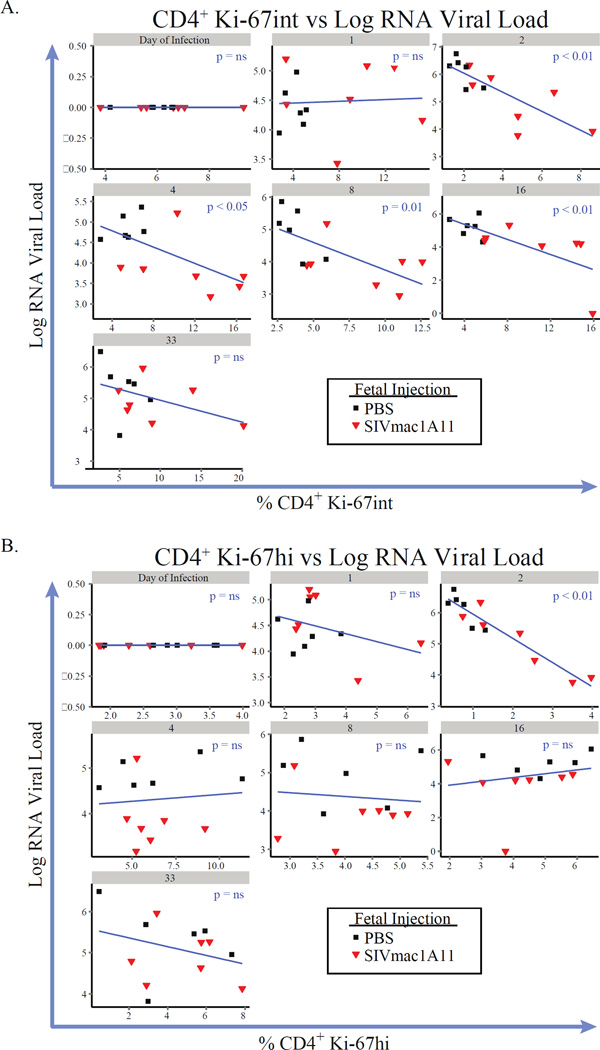
Fig. 5. Ki-67int cells are inversely correlated with viral load at multiple time points post-infection.
Linear regression analyses comparing the frequencies of CD4+ (A) Ki-67int or (B) Ki-67hi cells (x-axes) with log plasma RNA viral loads (y-axes) at each time point over the course of disease. Numbers in grey bars represent weeks post-infection.

