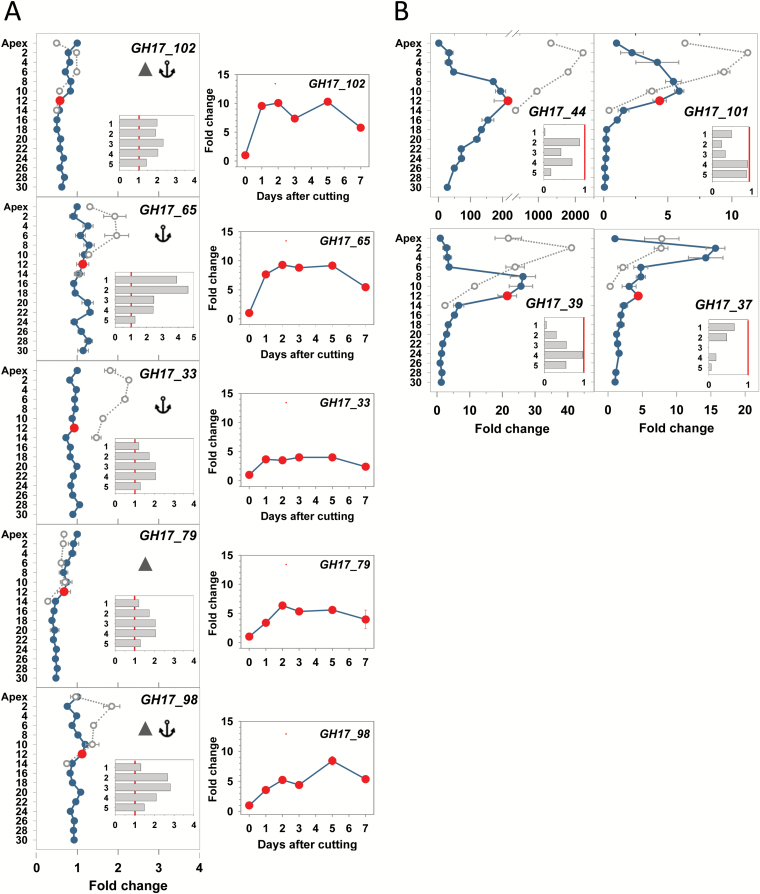
Fig. 4.
Expression analysis of α-clade and γ-clade GH17 genes in the apex and axillary buds (AXBs) developing under long and short days, and after stem decapitation. (A) α-Clade genes with a CBM43 domain (solid triangle) or GPI anchor (anchor), and (B) γ-clade genes with putative lipid body localization. Gene names and protein domains are indicated in each individual panel. Fold change under long days in the apex and AXBs (LD; blue dots and lines) and after 5 weeks of short days (SD; open circles, stippled lines) for the terminal bud and AXBs up to node 14 (A, left column; B). The red dot indicates the expression level in AXB 12 of intact plants, at the bud maturation point (BMP). After stem decapitation at the BMP, gene expression was measured at day 8 in five successive AXBs (1–5) directly proximal to the cut (insets; x-axis fold change), and (A, right column) during a 7 d period in AXB 12, proximal to the cut. The values are calculated relative to the apex expression level (set at 1), and in the inset relative to each individual AXB position before decapitation (set at 1, red line) and (A, right column) relative to AXB position 12 before decapitation. Values represent means of six plants ±SE, analyzed in two pooled samples.

