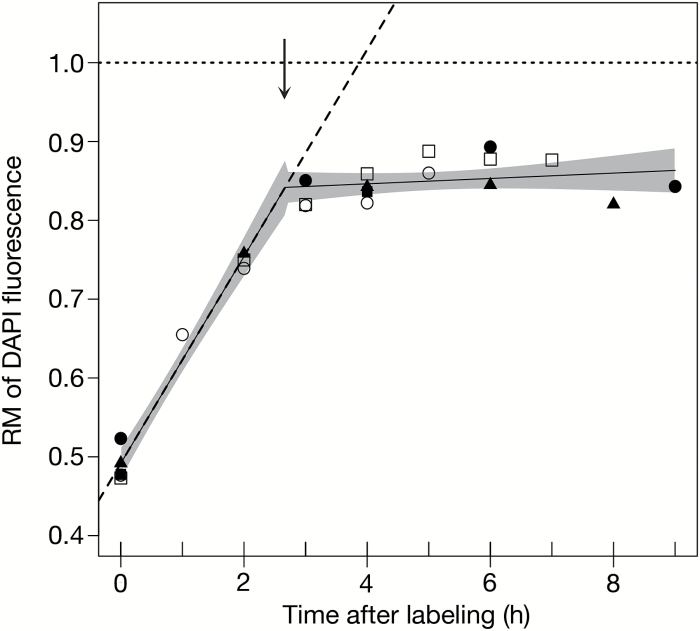
Fig. 2.
Relative movement plot and estimating S-phase duration in maize root tip cells. The relative movement (RM) of labeled nuclei at each time point was calculated using the equation RM=(FL–FG1)/(FG2/M–FG1) (Begg et al., 1985). The RM values from multiple biological replicates were combined and plotted as a function of time after EdU labeling. Biological replicates are indicated on the RM plot as follows: biological replicate 1, filled circle; 2, open circle; 3, filled square; 4, open square; and 5, filled triangle. A segmented linear regression analysis was used to fit two component lines (black lines) with a single breakpoint to the data of combined biological replicates. The 95% confidence intervals for the slopes of the two fitted lines are shaded in gray and the R 2 value for the segmented fit is 0.98. A lower S-phase duration estimate, 2.7h, was determined by the x-axis value at the breakpoint (vertical, downward arrow) and represents the average duration for the largest cohort of proliferating nuclei in maize root tips. The slope of the first linear component (y=0.1312x+0.4917) made up of data points below the breakpoint represents the initial rate of DNA replication. Extrapolation of this line (dashed line) to an RM of 1.0 (dotted line) gave a second, upper estimate of 3.9h for S-phase duration and accounts for more slowly proliferating nuclei.

