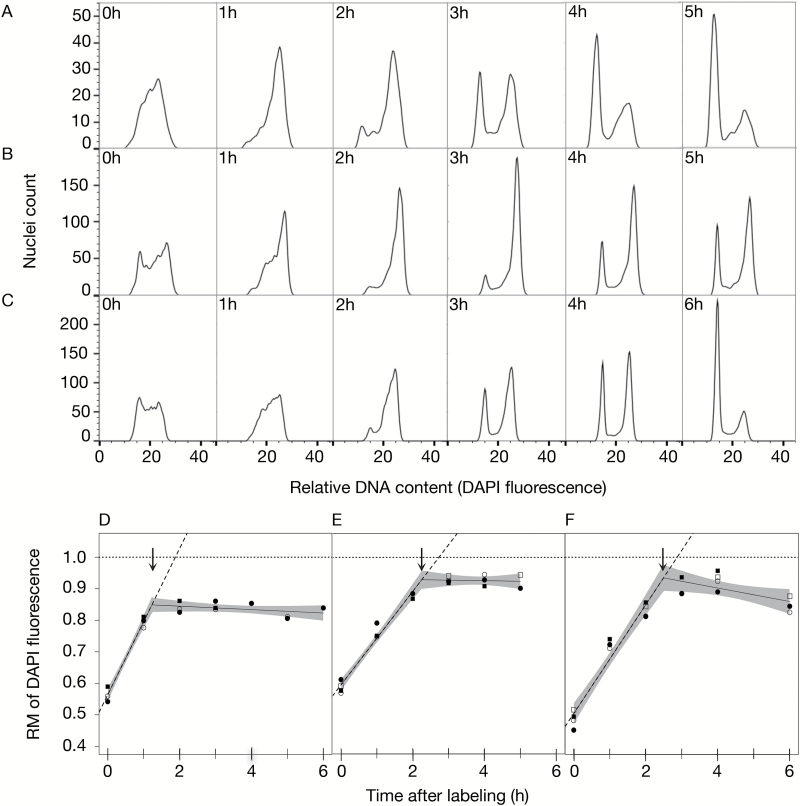
Fig. 3.
Estimation of S-phase duration in rice, barley, and wheat root tip cells. Roots from 4-day-old rice seedlings, 2-day-old barley seedlings, and 3-day-old wheat seedlings were pulse-labeled with 25 μM EdU for 30min, washed, and then chased with varying concentrations of thymidine (refer to the Materials and methods for details) for select hourly intervals. Terminal 5mm root segments were excised, fixed, and frozen. Nuclei were prepared and analyzed by flow cytometry as described in Fig. 1. (A–C) Histograms of relative DNA content of S-phase nuclei from an S-phase duration time course for (A) rice, (B) barley, and (C) wheat. (Corresponding flow cytograms are in Supplementary Fig. S2.) Data represent single biological replicates. (D–F) RM plots for (D) rice, (E) barley, and (F) wheat root tip cells. For each species, RM values from multiple biological replicates were calculated and plotted as a function of time. Segmented regression analysis was applied to the data of combined biological replicates as described in Fig. 2. The R 2 value of the segmented fit, slope of the first component line, and lower and upper average S-phase duration estimates are as follows: (D) rice, R 2=0.98, y=0.2318x+0.5635 and 1.2h/1.9h; (E) barley, R 2=0.98, y=0.1488x+0.5937 and 2.3h/2.7h; and (F) wheat, R 2=0.95, y=0.1727x+0.5038 and 2.5h/2.9h.

