Fig. 2.
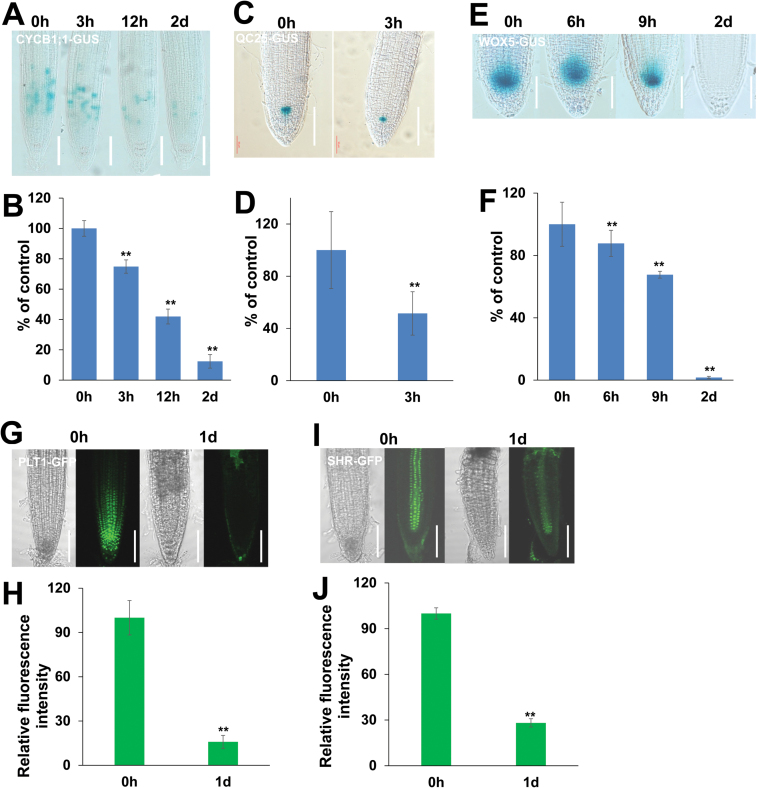
Effect of La on root meristem development. (A, B) Image of GUS staining (A) and the relative GUS activity (B) of 5-day-old CYCB1;1:GUS seedlings exposed to 150 μM La(NO3)3 for 3 h, 12 h, and 2 d. (C, D) Image of GUS staining (C) and the relative GUS activity (D) of 5-day-old QC25:GUS seedlings exposed to 150 μM La(NO3)3 for 3 h. (E, F) Image of GUS staining (E) and the relative GUS activity (F) of 5-day-old WOX5:GUS seedlings exposed to 150 μM La(NO3)3 for 6 h, 9 h, and 2 d. The GUS activity in the untreated roots was set to 100. Bar, 50 μm. (G, H) GFP fluorescence (G) and quantification of the PLT1:GFP fluorescence intensities (H) in the roots of 5-day-old PLT1:GFP seedlings exposed to 150 μM La(NO3)3 for 1 d. (I, J) GFP fluorescence (I) and quantification of the SHR:GFP fluorescence intensities (J) in the roots of 5-day-old SHR:GFP seedlings exposed to 150 μM La(NO3)3 for 1 d. The fluorescence intensity of the untreated roots was set to 100. Bar, 50 μm. n=60. The error bars represent the SEM. **P<0.01. (This figure is available in color at JXB online.)

