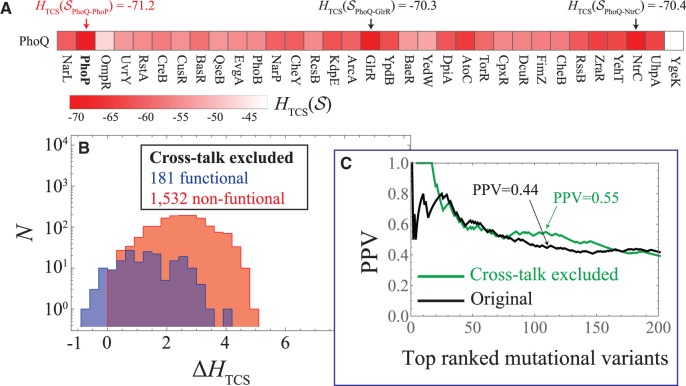
Fig. 3.
Excluding mutational variants that are inferred to cross-talk. (A) A grid plot showing (eq. 4) computed for the wild type PhoQ sequence with all of the non-hybrid RR protein sequences in E. coli, respectively. The most favorable interaction (most negative) given by is between PhoQ and its partner PhoP. (B) We plot the cross-talk excluded subset (181 functional 1,532 non-functional) in a histogram as a function of the similar to figure 2A. (C) We plot the PPV as a function of the N top mutational variants ranked by for the first 200 mutants. The PPV for the cross-talk excluded mutational variants from figure 3B is plotted in green whereas the original PPV (fig. 2B) is shown in black.

