Fig. 4.
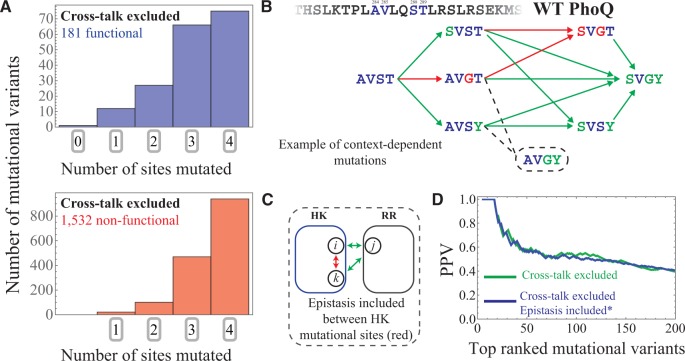
Capturing epistatic mutational effects. (A) Histograms of the 0, 1, 2, 3, and 4-site mutants are plotted for the 181 functional and 1,532 non-functional mutational variants in our cross-talk excluded subset that is predicted using (eq. 4). (B) An example of mutational context-dependence predicted by is shown here, considering residues 284, 285, 288 and 289 of PhoQ, which have the WT amino acid configuration AVST, respectively. Green arrows drawn from AVST indicate single point mutations that are correctly predicted to result in a functional phenotype. Successive green arrows indicate double and triple point mutations from the WT that are correctly predicted to be functional. Likewise, red arrows indicate single point mutations from an amino acid configuration that are correctly predicted to result in a non-functional phenotype. The AVGY mutation (dashed line and circle) was found to be functional in experiment but is predicted to cross-talk by . (C) The schematic shows intraprotein coevolution (red) between residues i and k (of the HK) and interprotein coevolution (green) between residues i and j as well as k and j. As previous described in figure 1C, interprotein coevolution captures the effects of mutating the HK when the RR is also mutated (or vice versa). Epistasis between HK and RR proteins are naturally incorporated within . On the other hand, epistasis between the 4-mutational sites of the Podgornaia and Laub experiment is described in our model through the statistical couplings between the 4-mutational sites (red in schematic). These additional parameters are added to to obtain (See “Materials and Methods” section). (D) We plot the PPV as a function of the N top mutational variants ranked by for the first 200 mutants. The PPV predicted by (fig. 3C) is shown in green whereas the PPV predicted by is shown in blue.

