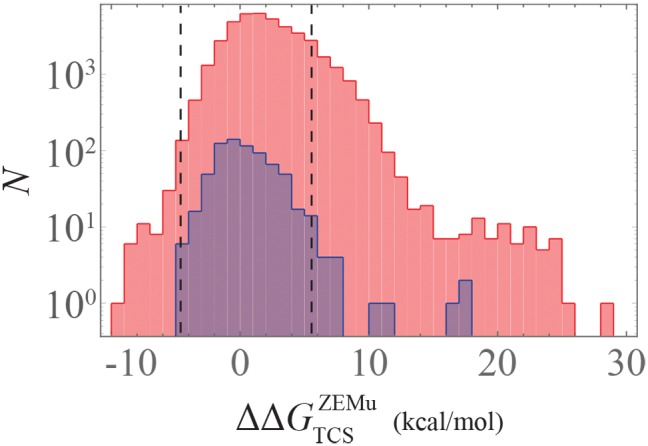
Fig. 5.

Mutational change in binding affinity for PhoQ/PhoP interaction. A histogram of (See “Materials and Methods” section), is plotted for the 702 functional (blue) and 42,283 non-functional (red) mutational variants analyzed in our study. The dashed lines denote ±2 standard deviations from the mean of the functional (blue) distribution.
