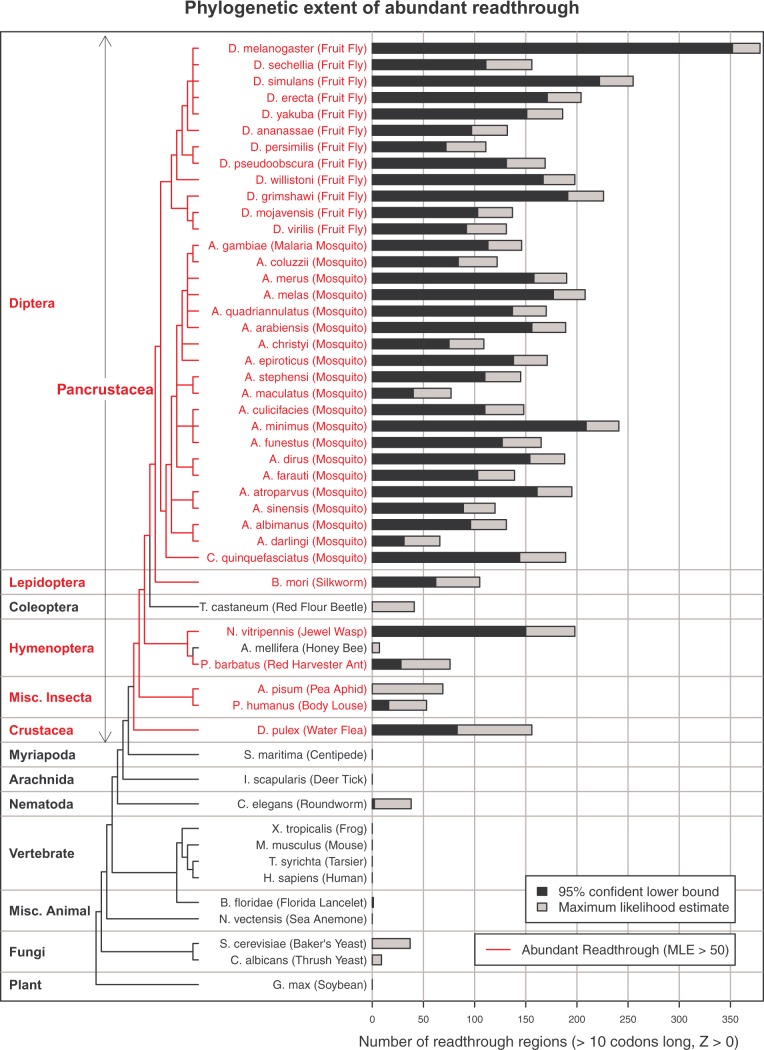
Fig. 5.
Estimated abundance of readthrough in 52 eukaryotic species. Estimate is calculated using single-species sequence-composition evidence quantified by Z curve scores for downstream ORFs in three frames to detect excess of positive scores in frame 0 associated with abundant readthrough. For each species, gray bar shows the maximum likelihood estimate of the number of functional readthrough transcripts among the subset of transcripts whose second ORFs are at least 10 codons long and have positive Z curve score, which probably includes fewer than one quarter of all functional readthrough transcripts, whereas black bar shows a 95% confidence lower bound. Tree shows phylogenetic relationships, with red branches indicating abundant readthrough, defined by maximum likelihood estimate greater than 50, which roughly corresponds to a 95% confidence lower bound greater than 0. Readthrough is abundant in all of the Anopheles and Drosophila species, most of the other insect species tested, and the crustacean, D. pulex, whereas none of the non-Pancrustacea species appear to have abundant readthrough, suggesting that it evolved in the Pancrustacea after they split from Myriapoda.

