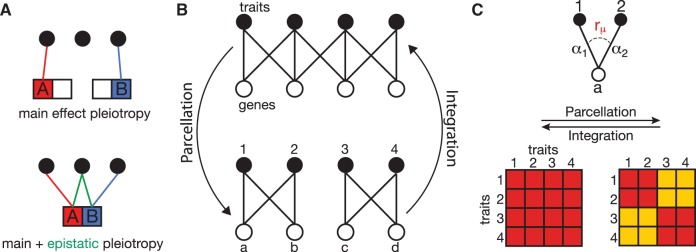
Fig. 1.
(A) two mutations A and B affect each one trait when alone and affect each two traits when together on the same sequence. The epistatic interaction between A and B thus has pleiotropy one and adds one trait to the trait repertoire of both A and B. (B) Genotype–phenotype maps, with edges between genes (empty circles) and traits (solid circles) representing the pleiotropic effects of the genes. Parcellation results from the decrease of the number of edges between trait modules (1–2 and 3–4). Integration is the reverse process (re-drawn from Wagner and Altenberg 1996). (C) A mutation in gene a has effects α1 on trait 1 and α2 on trait 2. The genetic correlation between α1 and α2 is . The two square grids below represent the strength of the among-trait correlations (genetic or phenotypic) resulting from the two GP maps in (B). The modular phenotypes (on the right) have lower correlations between modules (yellow) than within (red).

