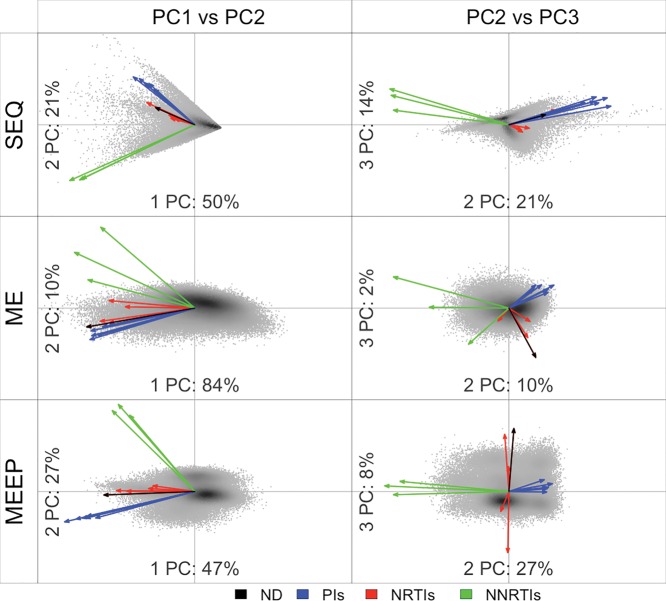
Fig. 6.
Principal component analysis of the G-matrices of sequence viral fitness (SEQ), of the main effects only (ME), and of the main and epistatic effects (MEEP) of the mutations in reverse transcriptase and protease. Gray dots indicate the relative positions of data points (virus log-fitness) within the two principal components (PCs) and arrows symbolize the positions of the original traits (drug environments) in this new phenotypic space. Drug classes are highlighted with colors. ND, no-drug condition.

