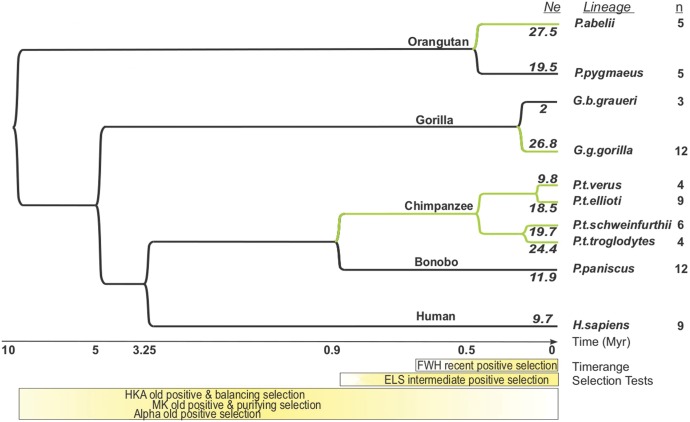
Fig. 1.
Timescale of neutrality tests. Hominidae phylogeny with the approximate time ranges where each neutrality test has power to detect signatures of natural selection. (a) The lineages with the number of genomes used in this study are shown on the right. The X-axis shows the timescale, in units of millions of years. Split times of lineages from Prado-Martinez et al. (2013). For FWH, MK and HKA, the approximate time range where the tests are inferred to have most power to detect selection are represented by color intensity. For ELS, we label in green the branches where the test has power to detect selection. n: number of individuals in each lineage. Ne: estimates of effective population size in units of thousands of individuals according to Watterson’s estimator, taken from Prado-Martinez et al. (2013).

