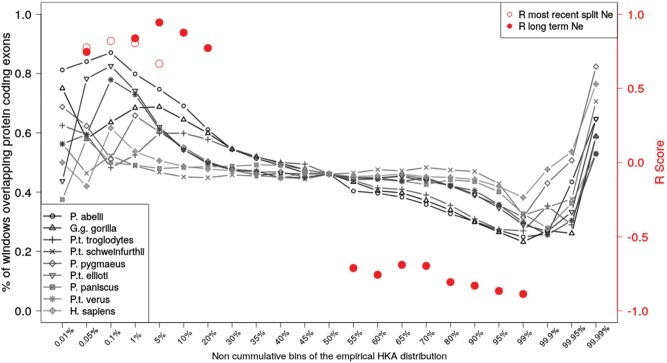
Fig. 3.
Percentage of windows overlapping protein coding exons. Percentage of windows overlapping protein coding exons for noncumulative bins of the HKA empirical distribution (X-axis). Each lineage is plotted as a shaded line. The Pearson’s correlation (R) between the percentage of windows overlapping protein coding exons and Ne within each HKA bin and across all lineages is shown on the right Y-axis. Pearson’s correlation coefficient was computed both with an estimate of short- and long-term Ne (from Prado-Martinez et al. 2013). Only R values with significant P values (P <0.05) are shown.

