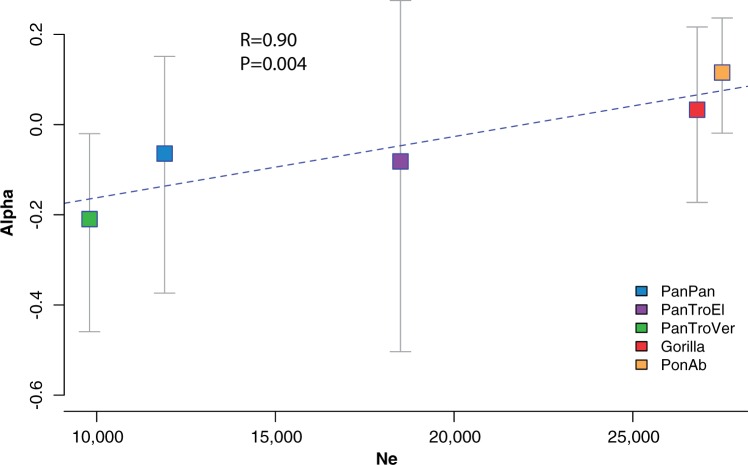
Fig. 4.
Correlation between rate of adaptive substitutions (α) and effective population size (Ne). The X-axis shows the effective population size. On the Y-axis, the rate of adaptive substitutions is plotted as α. Correlations were calculated while controlling for the phylogenetic nonindependence using a generalized least square approach and a random walk/maximum likelihood method (see Supplementary Materials MK 2.3, Supplementary Material online).

