
Fig. 1.
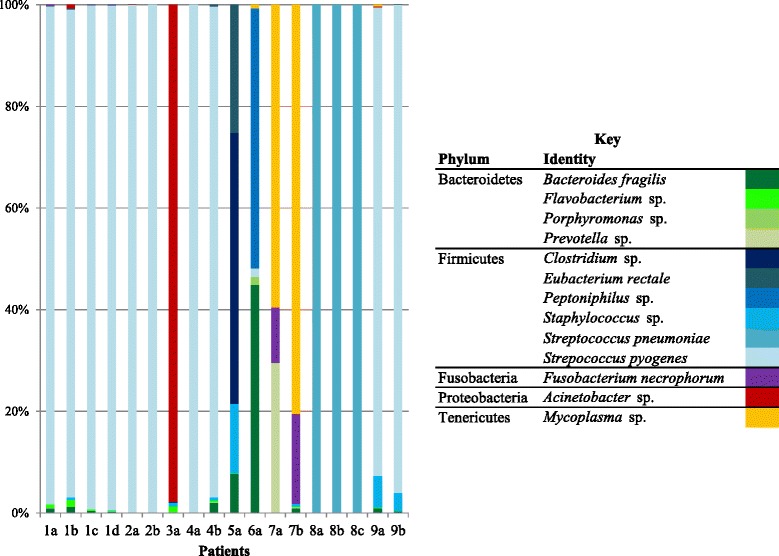
Taxa identified by pyrosequencing. The stacked graph illustrates the relative abundance of each taxon identified by pyrosequencing from the six samples (color coded according to the key)
Official websites use .gov
A
.gov website belongs to an official
government organization in the United States.
Secure .gov websites use HTTPS
A lock (
) or https:// means you've safely
connected to the .gov website. Share sensitive
information only on official, secure websites.
Taxa identified by pyrosequencing. The stacked graph illustrates the relative abundance of each taxon identified by pyrosequencing from the six samples (color coded according to the key)