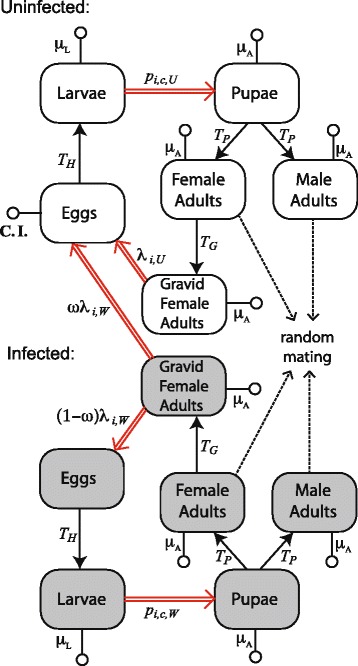
Fig. 1.

Model of mosquito–Wolbachia dynamics. Double red arrows indicate demographic rates that depend on larval density, solid arrows indicate fixed time lags, dotted arrows indicate mating interactions, and open circle terminators indicate mortality rates. Grey shading and no shading indicate Wolbachia-infected and uninfected life stages, respectively. Parameter symbols and values are defined in the text and Additional file 1: Table S1.1. The computer code for implementing our model (gyp_sim.cpp) has been made available (see doi 10.6084/m9.figshare.3980472)
