
Fig. 3.
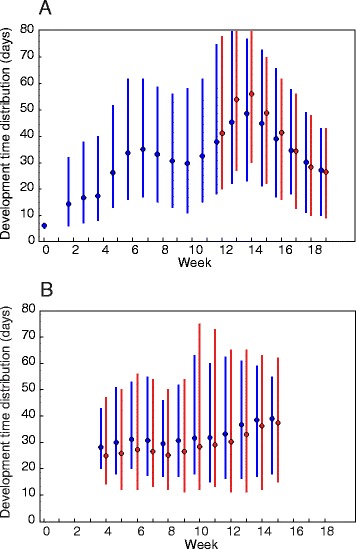
Predicted development time distributions of infected and uninfected larvae. a Population A; b Population B. Circles show the mean and vertical lines connect the 5 % and 95 % quantiles for uninfected (blue) and infected (red) larvae hatched in each week. The MCMC iteration with the maximum posterior probability is shown