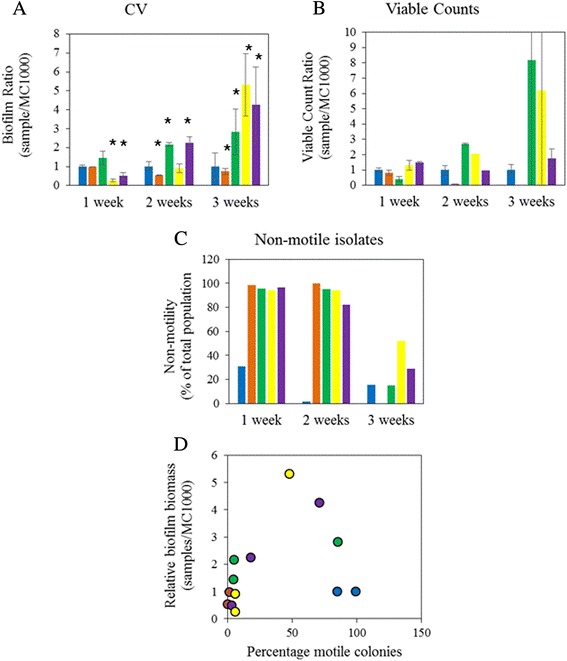
Fig. 4.

Biofilm biomass in mixed biofilms. Biofilm was grown by MC1000, BP19 and mixtures of MC1000 and BP19 in ratios of 1:10, 1:1, and 10:1. Biofilm amounts were determined weekly for 3 weeks by the CV assay a, viable cell counts were determined simultaneously (b). c indicates the percentage of non-motile bacteria in the biofilm, determined on motility plates. For a through c, blue bars are used for MC1000, orange bars for BP19, green bars for the 1:1 mixture, yellow for the 10:1 mixture, and purple for the 1:10 mixture. For d, data from a and c were combined and the relative biofilm biomass was plotted versus the percentage of motile isolates. The color code for the circles is identical to the color codes for the bars in (a) to (c)
