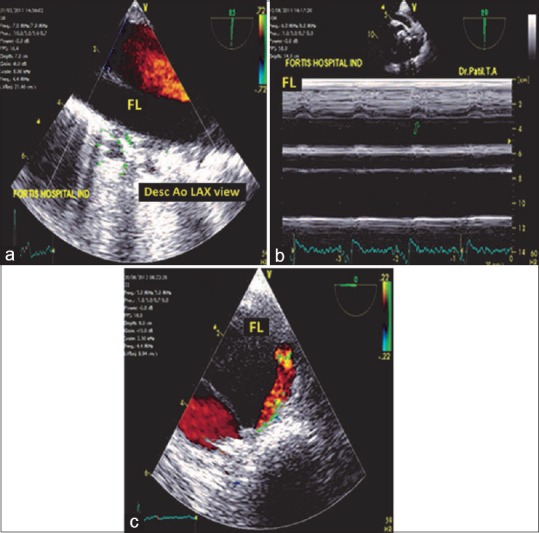
Figure 14.

(a) Descending aortic long-axis view with the systolic color flow Doppler in the true lumen. FL: False lumen. (b) M-mode echocardiography (arrow) indicating the systolic expansion of the true lumen toward the false lumen. (c) Descending aortic short axis view indicating the flow of blood by color flow Doppler from the true lumen to the false lumen in the late systolic phase. Note the tracer (red) on the electrocardiogram at the end of systole
