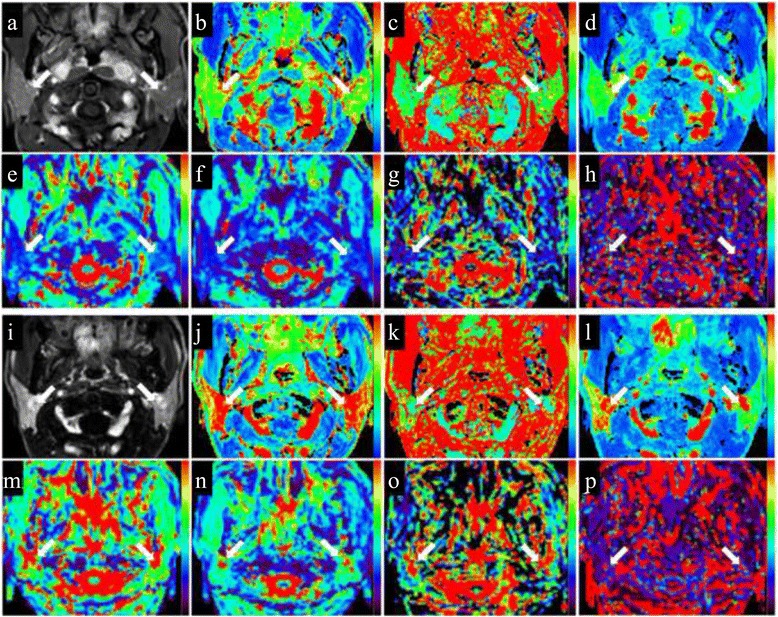
Fig. 2.

MR images of bilateral parotid glands (arrows) in one patient with nasopharyngeal carcinoma (NPC). a-h Dynamic contrast-enhanced (DCE, a-d) and intravoxel incoherent motion (IVIM, e-h) MR images within 2 weeks before radiotherapy (pre-RT). i-p DCE (i-l) and IVIM (m-p) MR images approximately 4 weeks after radiotherapy (post-RT). At pre-RT, the right and left parotid maximum relative enhancement (MRE, b), time to peak (TTP, c), Wash in Rate (d), apparent diffusion coefficient (ADC, e), pure diffusion coefficient (D, f), perfusion fraction (f, g), and pseudo-diffusion coefficient (D*, h) values are 222.8 and 243.7 %, 46.8 s and 52.0 s, 143.9 i/s and 100.7 i/s, 0.76 × 10⁻³ mm2/s and 0.85 × 10⁻³ mm2/s, 0.69 × 10⁻³ mm2/s and 0.73 × 10⁻³ mm2/s, 0.089 and 0.116, and 50.8 × 10⁻³ mm2/s and 32.2 × 10⁻³ mm2/s, respectively. At post-RT, the right and left parotid MRE (j), TTP (k), Wash in Rate (l), ADC (m), D (n), f (o), and D* (p) values are 335.6 and 357.9 %, 62.6 s and 83.5 s, 237.0 i/s and 146.4 i/s, 1.70 × 10⁻³ mm2/s and 1.59 × 10⁻³ mm2/s, 1.41 × 10⁻³ mm2/s and 1.31 × 10⁻³ mm2/s, 0.184 and 0.175, and 54.3 × 10⁻³ mm2/s and 39.0 × 10⁻³ mm2/s, respectively
