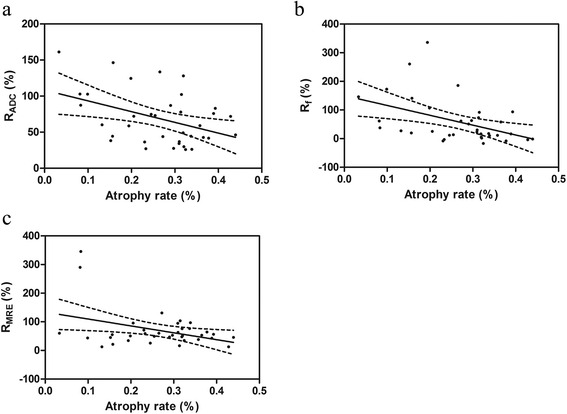
Fig. 3.

Scatter plots show that the change rates of apparent diffusion coefficient (ADC) (a), perfusion fraction (f) (b) and maximum relative enhancement (MRE) (c) values are significantly correlated with the parotid atrophy rate from pre-RT (approximately 2 weeks before radiotherapy) to post-RT (approximately 4 weeks after radiotherapy). RADC, Rf and RMRE are the change rates of ADC, f and MRE values from pre-RT to post-RT, respectively. The dashed lines are the 95 % confidence bands
